Creating hidden series in Grafana
When exploring dashboards, we often need to find or calculate other numbers based on the numbers we're given.
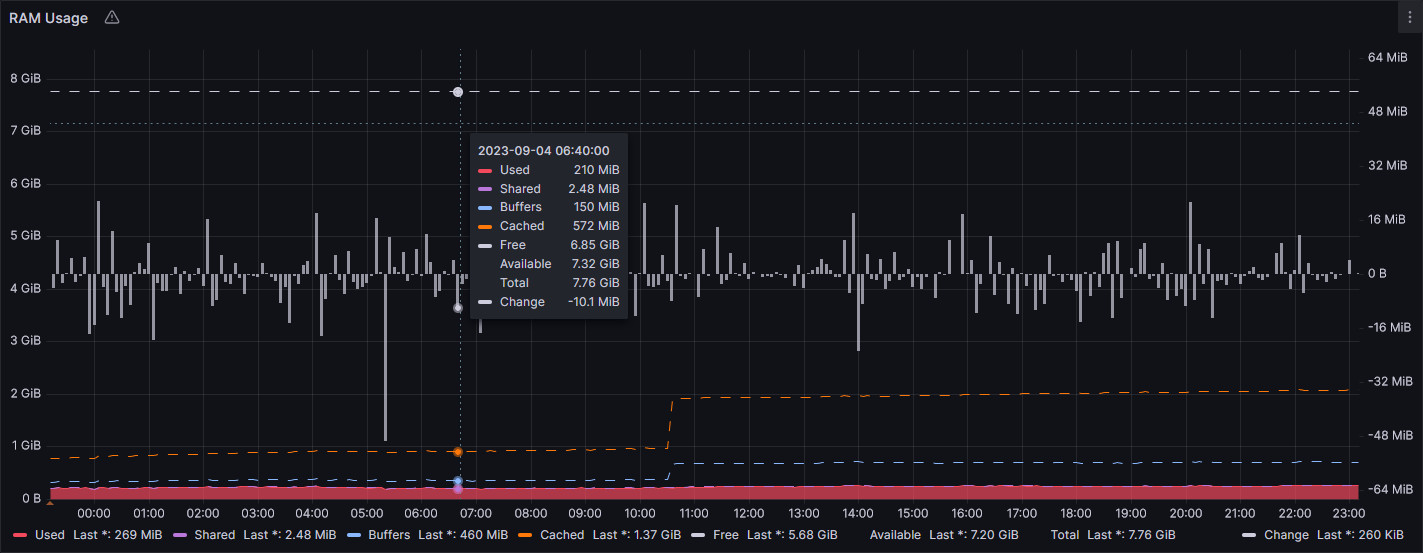
For example, for a graph there's a graph showing used and free RAM as stacked series to represent total RAM. It would be useful to know the value of available and total RAM at any given point in time. We can't include those additional series on the same axis since it would stack with the others and not make sense. Putting them on the right axis would clutter the graph. They could be added as separate panels, but then they'd take up more dashboard space and we'd need to look for them every time we needed to know the numbers.
Ideally we'd be able to see those numbers only when we hovered over a point in time on the graph. It's space effecient and convenient.
Doing that is a bit more complicated than it looks and requires knowing about multiple Grafana features and working around some buggy behaviour.
Overrides
To be able to assign additional series to a separate axis and hide them, we'll need to apply "Overrides" from the sidebar. This lets us add series-specific configuration. Since we're matching multiple series, we'll need to use the regex option, generally it's the most flexible option. For our regex, we can use a /(Total|Available)/ pattern. Where "Total" and "Available" are the name of our series.
Hidden axis
For our overrides, we'll need to move our series to their own axis so that they don't mess with the visible axis. Grafana provides three options under "Axis > Placement": "Left", "Right" and "Hidden". We want "Hidden" as we don't want the axis to be visible.
Note, the hidden option does not hide the series, it's still visible. The axis itself is hidden. It's a third axis, so the series is not using the right axis or left axis.
Hidden line
The next step is to hide the series. We can do this by setting the "Graph styles > Line width" override to "0". Depending on your panel configuration, you may also need to set "Fill opacity" to "0", "Show points" to "Never", among other things.
Hidden hover point
When we hover over the graph, we can still see a point representing the series' value at that point in time. This is confusing as the point is not aligned to the left or right axis. Ideally it should be hidden too.
Here's the not-so intuitive part of this process. To completely hide the series point when we hover over the graph, we need to override "Standard options > Max" to a number below any possible value of the hidden series, essentially putting the series out of bounds so that it's never visible. This is usually "-1" if your series is always positive. Otherwise, try "-9007199254740991" (the lowest safe integer). You can alternatively use "Min" instead if that works for your series.
You might be thinking that since the series is now out of bounds, we don't need to do the step in "Hidden line". However, not doing so will trigger a bug in Grafana. Your graph will take 10 seconds to load and any time you resize, configure or do literally anything with the graph you'll need to wait another 10 seconds. During which time your web browser will freeze, at least on Firefox. I think it's because Grafana does a ton of calculations thinking it needs to render the series, and since it's out of bounds, those calculations go haywire. So yeah, don't skip any steps.
Now the series should be completely hidden, even if we hover over it.
Hidden color
For the final step, we'll hide the colour in the legend and tooltip so that people know that the series is hidden.
We can set "Standard options > Color scheme" to "Single color" and choosing the bottom-left colour from the "Colors" tab on the colour picker, or from the "Custom" tab set `rgba(0,0,0,0)``. This makes the colour transparent.
Conclusion
And we're done! We now have a completely hidden series which is only visible in the tooltip when we hover over the graph.
To summarise, this is the configuration we need:
- Overrides
- Fields with name matching regex:
/(Total|Available)/ - Axis
- Placement: "Hidden"
- Graph styles
- Line width:
0 - Fill opacity:
0 - Show points: "Never"
- Line width:
- Standard options
- Max:
-1if your series is positive, otherwise use whatever's out of bounds. - Color scheme: "Single color",
rgba(0,0,0,0)
- Max:
- Fields with name matching regex:
Thanks for reading.