On-Demand Dashboards with Elasticsearch and Kibana
At the end of my post on Simple Event Tracking with Nginx, I briefly mentioned Elasticsearch. In this post, I'll go into more detail on how I query those logs using Elasticsearch and Kibana.
Originally I used jq to run queries on my logs. For example, to get a count of referrers I can run:
zcat /var/log/nginx/event.log-*.gz \
  | jq -r 'select(.http_user_agent | contains("bot") or contains("Bot") | not) | .request_body' \
  | jq -r 'select(.message == "start") | .referrer' \
  | sort \
  | uniq -c \
  | sort -n
This sort of approach is fine for initial exploration, but having to manually run and tweak a script every time can be slow and tedious, especially with large sets of data.
When it comes to storing and querying JSON, the most common self-hosted, cost-free solution is Elasticsearch, typically with an interface on top like Kibana and that's exactly what I use.
How about a Live Service?
Before I go into my approach, I'd like to mention why I don't have a live service that automatically processes events as they come in. Simply put, for small projects, maintaining a live service takes time and effort. Scaling to meet traffic demands, server costs, updates, uptime and so on.
There's no real need to have a live service if it's viable on-demand, which is true in my case. Nginx logs events to disk, and I can pull them down every week or month to analyse them. If I need a live service, I can more or less take what I have, put it on a server, and scale it if needed.
Starting Services
The easiest way to start Elasticsearcn and Kibana locally is to use Elastic's official Docker images. They even provide a docker-compose.yml to get started.
In my case, I use Podman which is an open-source tool with a similar interface to Docker. Podman is a lot simpler and doesn't require root access while pretty much supporting everything Docker does. However, you'll need to disable the memlock flags in the docker-compose.yml as those require root permissions.
Once your docker-compose.yml is ready, start it up.
podman-compose up # or docker-compose upMake sure everything started correctly, it can take a minute. Go through the log output and as the Elastic's guide suggests, try making a request to Elasticsearch and opening up Kibana on http://localhost:5601.
As the logs might suggest, you may need to increase some system parameters. Below is an example, but it depends on your system and whether you want it to be set permanently or not.
sudo /sbin/sysctl -w vm.max_map_count=262144Once everything is working, you can use start and stop to easily manage the services in the future and attach to see runtime output.
Creating a Pipeline
Before creating an Index to store our events, let's create a Default Pipeline for it. This will be used to process any data and tidy things up. I'll go through what each processor is doing below.
curl -X PUT "http://localhost:9200/_ingest/pipeline/events?pretty" -H 'Content-Type: application/json' -d'
{
  "description" : "Processes events.",
  "processors" : [
    {
      "json" : {
        "field" : "request_body",
        "target_field" : "event"
      }
    },
    {
      "geoip" : {
        "field" : "http_x_forwarded_for"
      }
    },
    {
      "user_agent" : {
        "field" : "http_user_agent"
      }
    },
    {
      "set": {
        "field": "event.message",
        "value": "{{event.error}}",
        "override": false,
        "ignore_empty_value": true
      }
    },
    {
      "grok": {
        "field": "event.referrer",
        "patterns": [".+://%{URIHOST:referrer_host}"],
        "ignore_failure": true
      }
    }
  ]
}
'
json processor is parsing the event payload and storing it in an event field, as explained in the previous post I mentioned before.
geoip is getting the approximate location of an IP address from a lookup.
user_agent is parsing the user agent to get the OS, browser vendor, version and so on so you don't have to.
set is used to set a default message if it's not available using the error field. This way, you don't need to track an error message twice just for querying convenience.
grok is extracting the host from the referrer URL so you can group by host rather than URL.
Creating an Index
When creating the index, make sure to set the default pipeline so the you don't need to include it when pushing every event. Also, to use Kibana's "Maps" visualisation, you'll need to set the correct type for the location provided by geoip. Unlike everything else Elasticsearch can't guess it for you.
curl -X PUT "http://localhost:9200/events?pretty" -H 'Content-Type: application/json' -d'
{
  "settings": {
    "default_pipeline": "events"
  },
  "mappings": {
    "dynamic": true,
    "properties": {
      "geoip": {
        "properties": {
          "location": { "type": "geo_point" }
        }
      }
    }
  }
}
'
Pulling Events
Pulling events is as simple as a single rsync.
rsync -v -a --include 'event.log-*.gz' --exclude='*' [email protected]:/var/log/nginx/ /tmp/events/You can also delete the remote logs as they're pulled by using --remove-source-files.
I'm also pulling them into /tmp/events/ because it's on tmpfs (i.e. ramdisk) so it's faster to process and once I've push them to Elasticsearch, I won't need them.
Pushing Events to Elasticsearch
This step has multiple solutions. You can send events one-by-one or do it in batches. I'm currently doing it in batches as it's convenient, but there are likely some limitations I haven't hit yet.
zcat -r "/tmp/events" \
  | awk '{$0 = "{ \"index\" : { \"_index\" : \"events\" } }\n"$0} 1' \
  | cat - <(echo) \
  | curl -X POST "http://localhost:9200/_bulk?pretty" -H 'Content-Type: application/json' --data-binary @-
I'm using awk to add meta information for every event. This is needed for the batch processing API. The API also needs a newline at the end which is what cat is doing afterwards.
You can also push events directly from your logs to Elasticsearch without pulling them first, but that depends on your current network setup.
Creating an Index Pattern in Kibana
Now we've got Elasticsearch ready, it's time to switch to Kibana. This is more GUI-heavy so it should be self-explanatory.
First, you'll need to create an Index Pattern so Kibana will know how to deal with your Elasticsearch Index. You can find this option from the sidebar, "Index Management" and then "Index Patterns".
Once created, it'll keep a list of all the fields. Bear in mind, if you ever add or remove fields from your Index in Elasticsearch, you will need to refresh your Index Pattern.
You're Ready
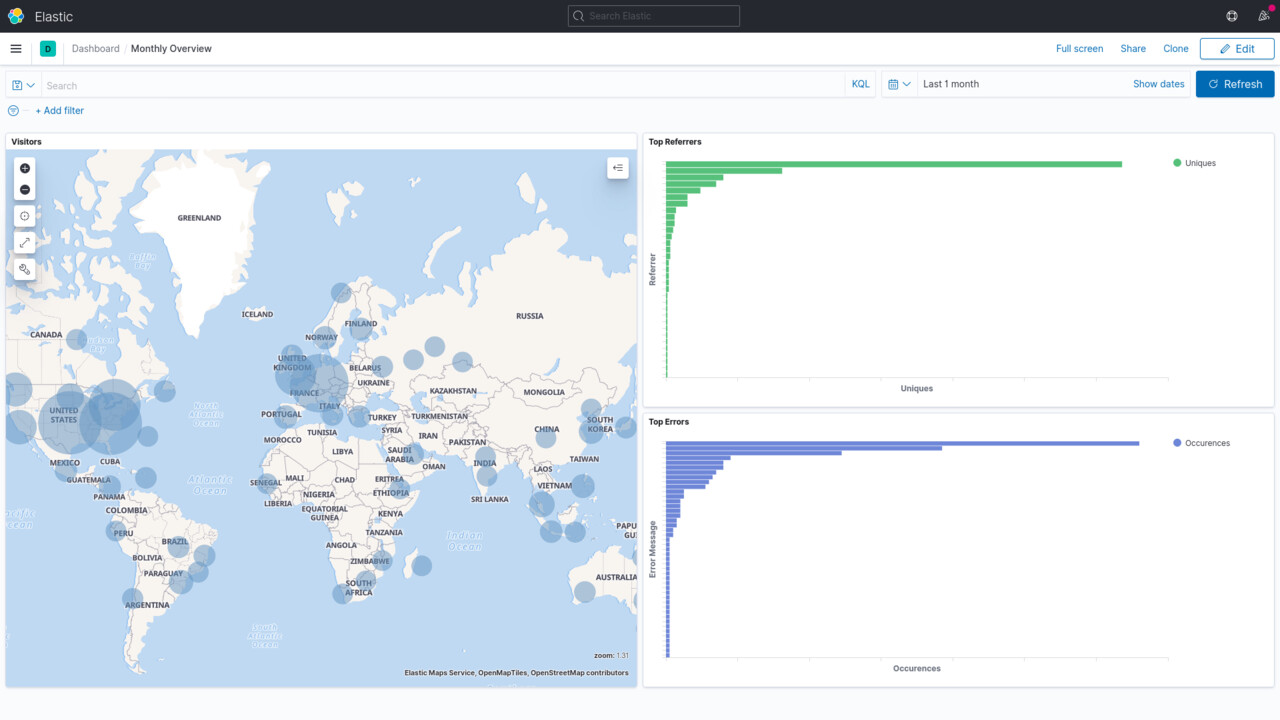
At this point, everything is ready. You can use Kibana's various features to build graphs, queries, maps and dashboards however you like.
Why Stop There?
Now that your logs are in Elasticsearch, you can just as easily start up a Grafana service and create dashboards there if you prefer. Personally, I like using Kibana for this on-demand use case because it's a single service that also lets me easily analyse events. The querying capabilities are a bit simple compared to something like Splunk, but it's more than enough for me and the setup is a lot easier to maintain.
Thanks for reading.